Bullish projections
Rule of 7: Quick Guide
Arthur Sklarew’s Rule of 7 projects expansion targets from the first impulsive leg after a breakout. All credit for the method goes to him—this tool just makes it visual and beginner-friendly so you can apply it consistently.
Inputs
- Asset: ETF, Stock, or Crypto.
- Mode: Bullish or Bearish.
- Basis: Candles or Lines. Be consistent for both anchors.
- Prior Low/High: the confirmed pivot.
- First Wave High/Low: the first strong move in the new direction.
Calculations
Bullish: L = High − Low. Targets = Low + L × 7/4, 7/3, 7/2, 7/1 (1.75, 2.33, 3.50, 7.00).
Bearish: L = High − Low. Targets = High − L × 7/4, 7/3, 7/2, 7/1.
Projected pullbacks after each target
After a target is tagged, price often corrects part of the most recent advance. The tool shows a pullback band for each target using retracements of the leg into that target: 38.2%, 50%, and 61.8%.
- Bullish: levels = Target n − {0.382, 0.50, 0.618} × leg size.
- Bearish: levels = Target n + {0.382, 0.50, 0.618} × leg size.
Impulse rules and re-anchoring
- Minimum preferable impulse size by asset: ETF ≥ 4%, Stock ≥ 5% (8% for small or mid caps), Crypto ≥ 10–12%.
- Where to start: begin at the confirmed pivot that precedes the first strong drive (use closes if you selected Lines).
- If price makes a new pivot against your anchor (lower low in bull; higher high in bear), re-select the pivot and re-measure L.
- Stops usually go below the pivot low in bull mode or above the pivot high in bear mode. Consider partial exits at T1 and T2.
Reading the results
- Target 1 first objective, highest probability.
- Target 2 medium probability.
- Target 3 stretch target.
- Target 4 extreme stretch (keep in view, but treat as optional unless momentum is exceptional).
- Yellow outline means the target is near a Fib extension within your tolerance.
Confluence tolerance %
How close a target must be to a Fib to count as near. Start with ETF 0.5%, Stocks 1.0%, Crypto 2.0. Tighten if too many highlights; widen if none.
Invalidation: when targets no longer apply
- Anchor break: bull sequence makes a new low; bear sequence makes a new high — re-anchor from the new pivot.
- Insufficient impulse: first leg is too small for the asset (below the minimum preferable or clearly below typical ATR%).
- Deep pre-T1 retracement: >61.8% retrace of L before T1 tags.
- Regime/structure shift: major gap, earnings/macro shock, or trend flip that redefines structure.
- Timeframe conflict: higher timeframe prints an opposing pivot that dominates your working leg.
- Liquidity distortions/outliers: halts, split artifacts, illiquid spikes that make L unrepresentative.
- Mis-anchoring: measuring from a minor pause instead of the real swing pivot that started the move.
Quality hint (optional ATR lens)
A healthy first leg is often around ≥1–1.5× a typical daily ATR on your timeframe. If your impulse is much smaller, consider waiting for a clearer thrust.
Visual guides: NVDA, 1D
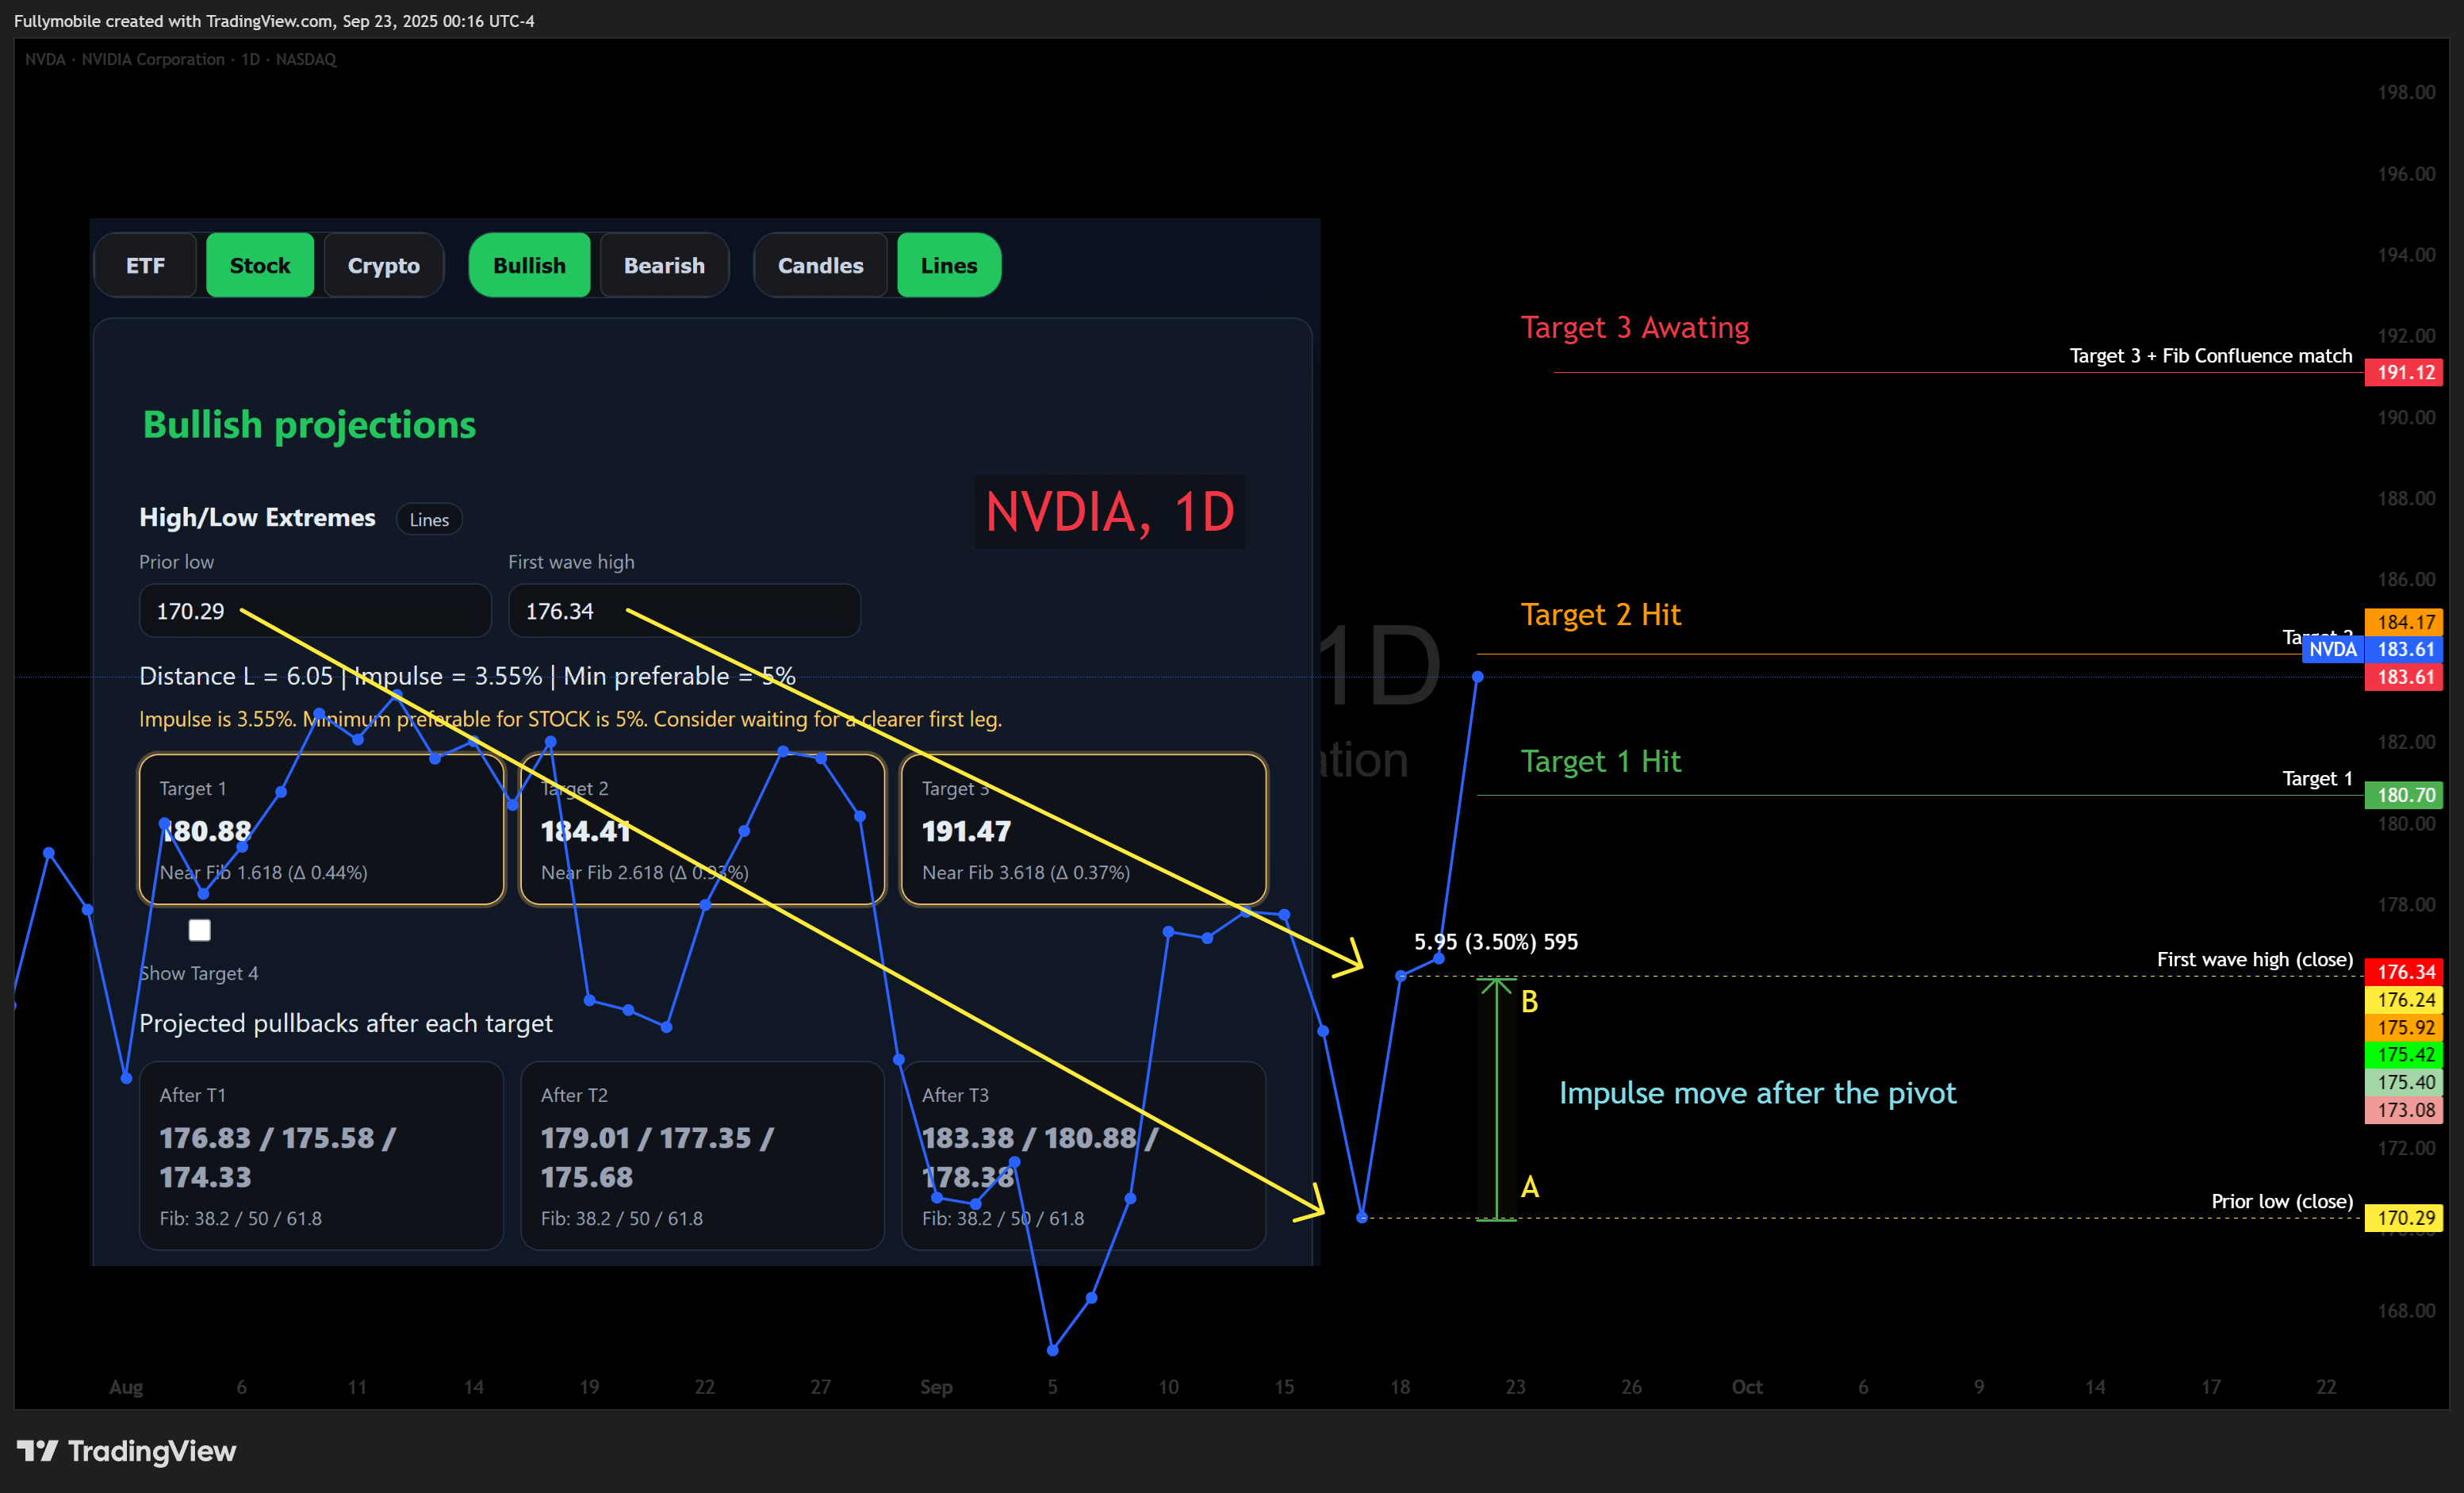
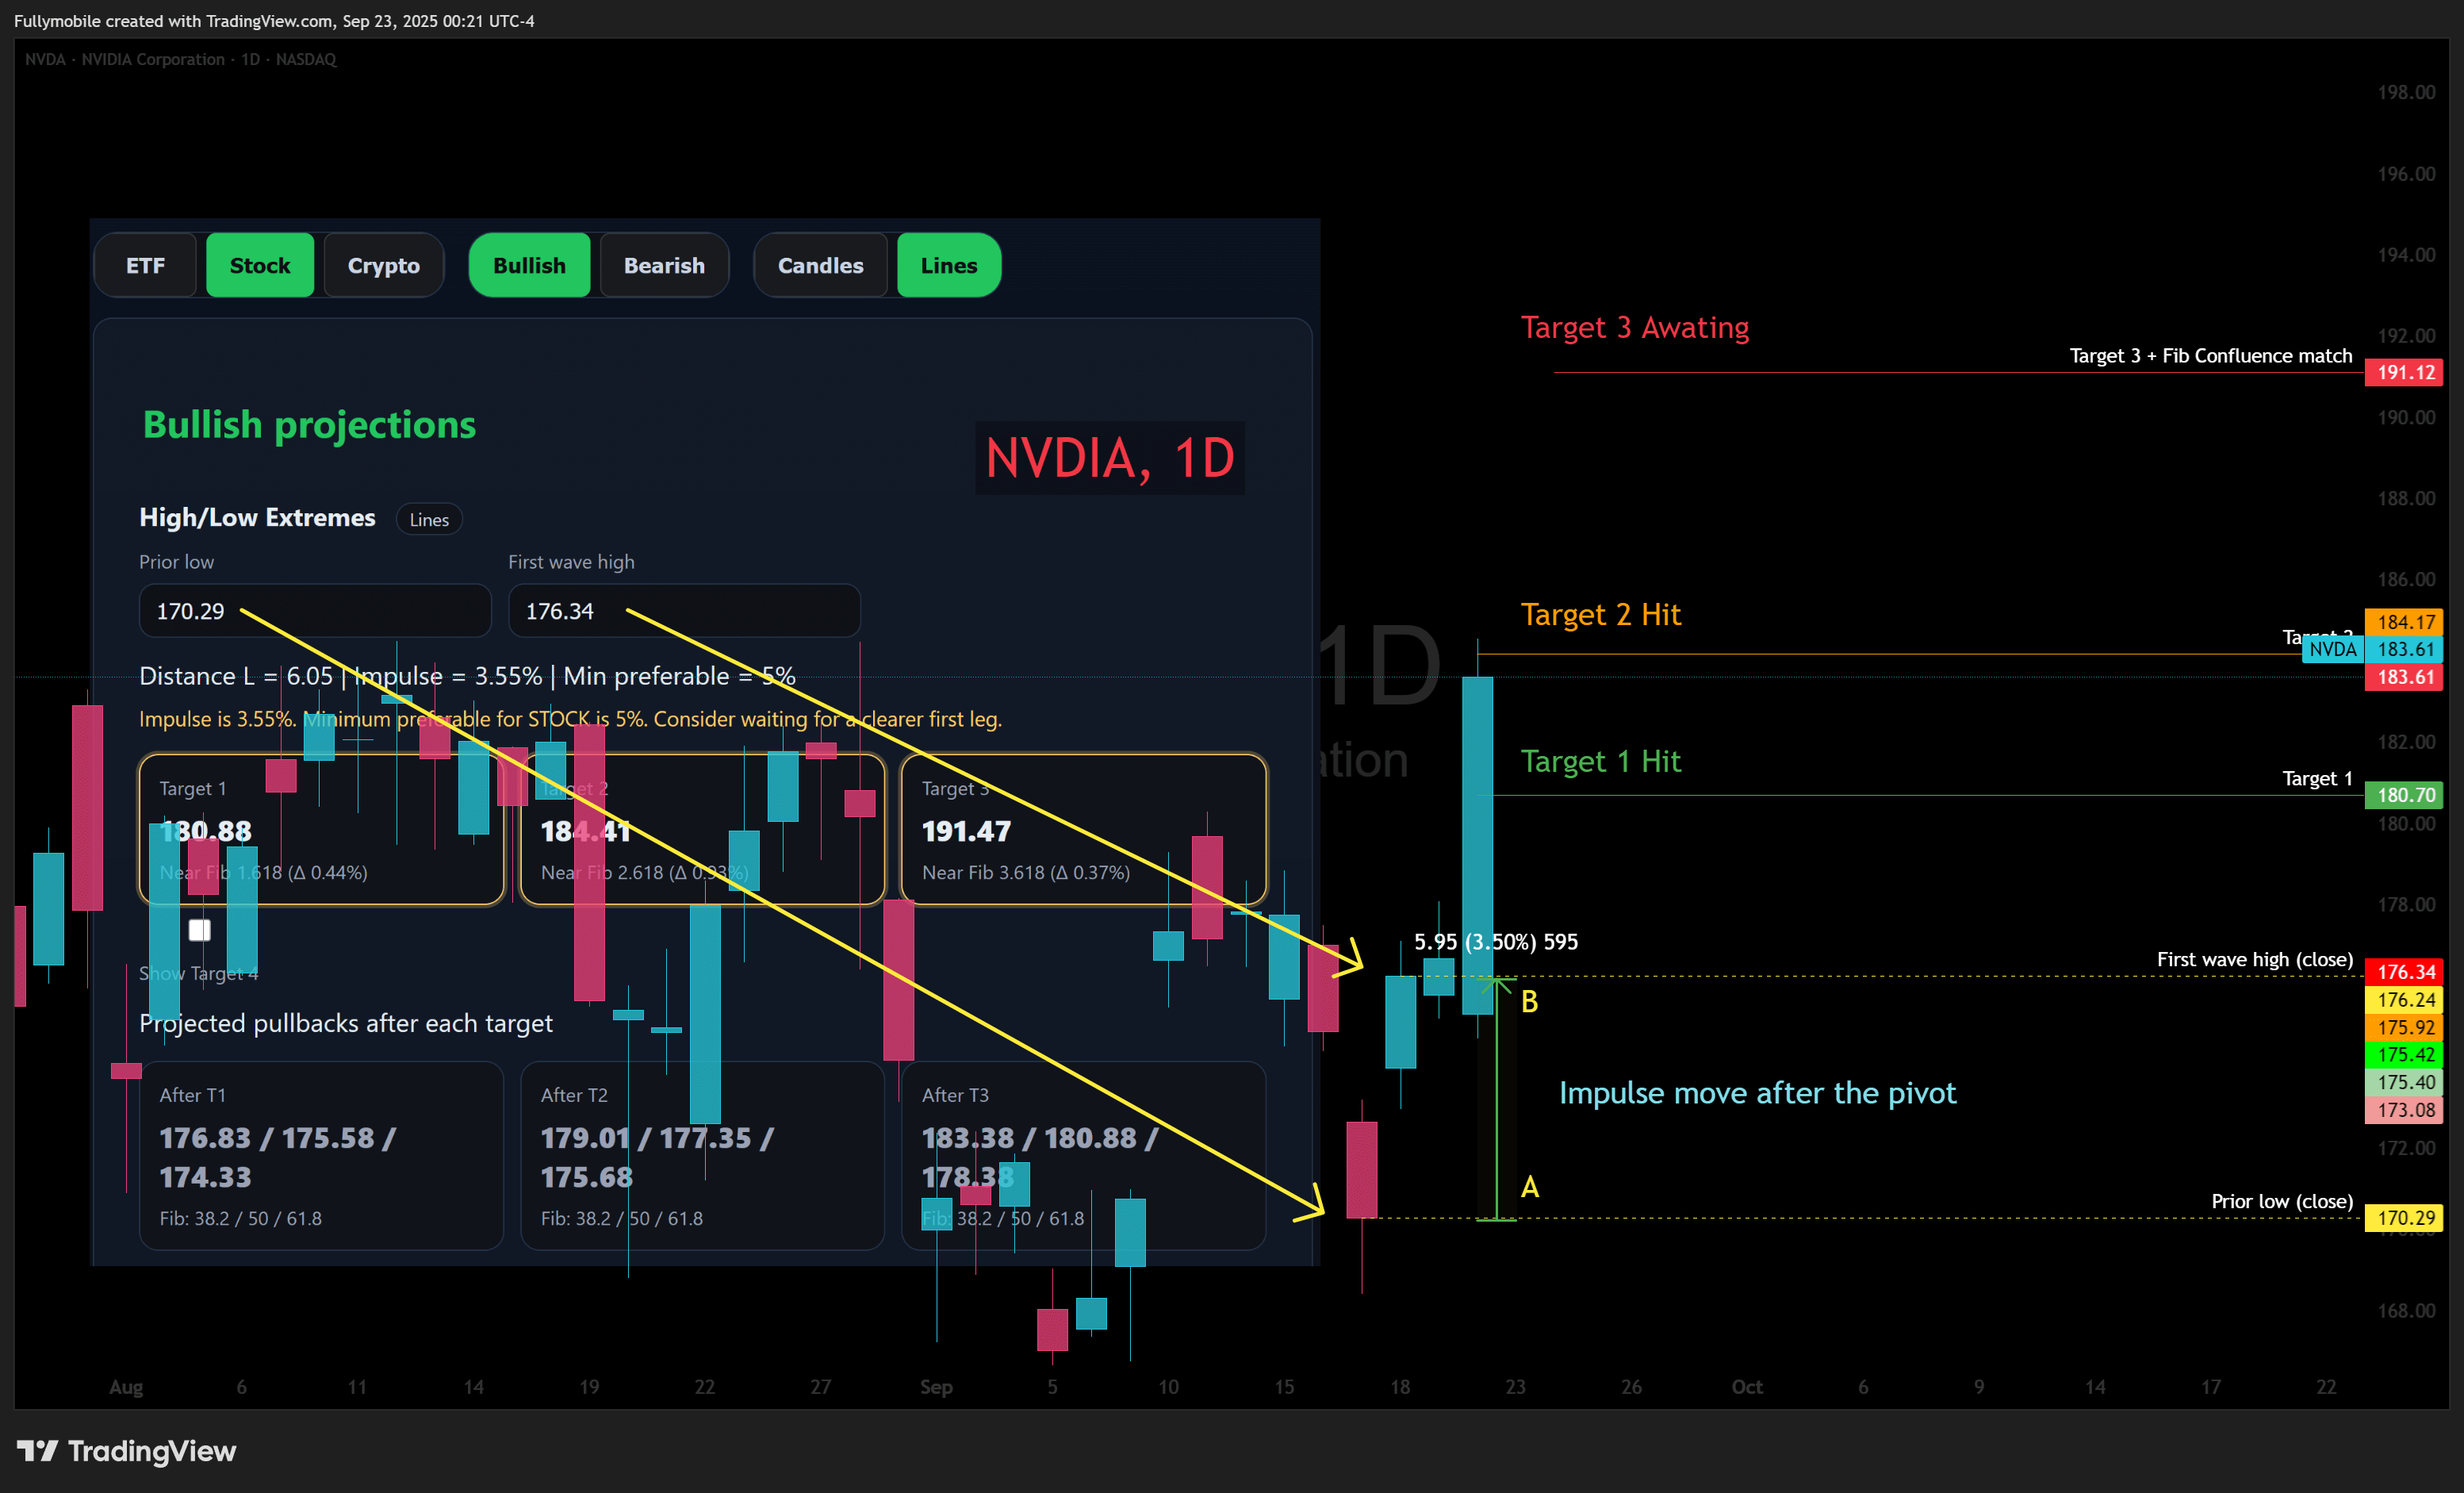
Click any image to open a large view.
What Rule of 7 actually is
The Rule of 7 projects expansion targets from the first impulsive leg after a breakout. Measure the thrust length L from the breakout point to the first strong drive. Then add multiples of L to the breakout point for uptrends, or subtract for downtrends.
Classic multipliers: 1.75, 2.33, 3.50, 7.00.
Example: breakout confirms at 100, the first strong drive peaks at 112, so L = 12.
T1 = 100 + 1.75 × 12 = 121.0 • T2 ≈ 128.0 • T3 = 142.0 • T4 = 184.0
How to define a confluence
A confluence zone is where an R7 target sits near other independent levels. Prioritize:
- Market structure: prior swing, base/breakdown level, gap edge
- Fibonacci extensions: 1.272, 1.414, 1.618, 2.000, 2.618, 3.618 of the same thrust (toggle extra 2.272 & 2.414 in the toolbar)
- Anchored VWAP from the thrust start (and bands)
- Volume profile nodes (HVN/LVN) aligned to target
- Timeframe MAs (D50/D200 or W20/W50)
- Round numbers and option strikes with heavy OI
- Momentum tells: RSI/MACD divergences, OBV stall
F.A.Q.
Do these targets always hit?
No. R7 provides objective targets, not guarantees. Targets are reached when trend quality remains intact and liquidity is healthy.
Wicks or closes—what should I measure?
If you choose Lines, use closing prices for both anchors. If you choose Candles, measure wick-to-wick. Be consistent—mixing the two will skew L and the targets.
When should I re-anchor and recalculate?
- Bullish: a lower low prints before the next target.
- Bearish: a higher high prints before the next target.
- The first leg was likely noise (below the minimum preferable or well under typical ATR).
- A deep retrace (>61.8% of the impulse) occurs before T1.
What tolerance should I use for Fib confluence?
Start with ETF 0.5%, Stocks 1.0%, Crypto 2.0. Tighten if too many targets highlight; widen if none do.
Why combine Rule of 7 with Fibonacci extensions?
Different tools, same job: R7 projects fixed multiples of the first impulse (1.75, 2.33, 3.50, 7.00). Fibonacci extensions project proportional growth of that same impulse (1.272, 1.414, 1.618, 2.000, 2.618, 3.618). Because the math is independent, overlap = confluence and often marks where reactions cluster.
- What each adds: R7 gives clean staircase targets for planning (T1–T3, optional T4). Fibs add granularity between them and catch levels R7 doesn’t land on.
- How we mark “near”: a small relative tolerance band (e.g., 1% for stocks) so matches aren’t just noise.
- Best use: clean, impulsive starts from a pivot or base; fast movers where extensions tend to print.
- Be cautious: tiny first legs, choppy regimes, or heavy event risk—levels can be steamrolled.
A yellow outline on a target means at least one enabled Fib sits within your tolerance. Treat it as a higher-interest zone, not a guarantee—plan for both respect and break.
Why show Target 4?
T4 (7×L) is an extreme stretch. It’s useful for trend-mature runs and for scenario planning. Toggle it off if you’re focusing on conservative scaling (T1–T3).
What does “Extra Fibs 2.272 & 2.414” do?
Adds two less-common—but popular—extensions between 2.0 and 2.618. They can sometimes align better with fast moves.
Can I use this intraday?
Yes. Use the same anchors on your intraday timeframe. For quality, prefer impulses that are ≥1× your typical intraday ATR for that symbol.